E-commerce distribution
Volatile inbound and outbound peaks, changing SKU velocity, shared aisles and constrained staging make congestion and exception recovery part of the rate calculation.
Compare warehouse robotics requirements through load structure, route variability, shared traffic, peak windows and system-record boundaries—not by industry label alone.
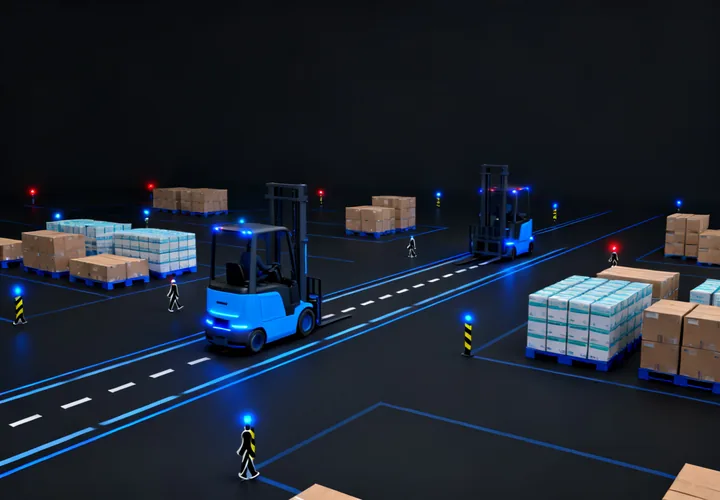
Each card names a typical decision boundary. Site measurements, procedures and applicable standards remain authoritative.
Volatile inbound and outbound peaks, changing SKU velocity, shared aisles and constrained staging make congestion and exception recovery part of the rate calculation.
Line-side replenishment links route availability to takt, container geometry, manual tugger traffic and escalation when a destination is unavailable.
Temperature zones, door cycles, condensation, battery context and exposure time affect route design and the safe location for intervention.
Controlled access, batch status, traceable system messages and deviation handling increase the importance of interface records and approved operating roles.
Record exact units and conditions. A loads/hour figure without route, peak window, traffic and exception assumptions cannot support a comparable decision.
| Requirement | Distribution | Manufacturing | Controlled environments |
|---|---|---|---|
| Load basis | Mixed pallets; damaged-load rule | Repeatable container and pickup face | Traceability and access state |
| Rate basis | Baseline plus carrier-cutoff peak | Line call and replenishment cadence | Batch or release window |
| Route basis | Congestion, crossings, buffer occupancy | Shared traffic and blocked destination | Doors, zones and authorized access |
| Interface basis | WMS/WCS task and lane state | PLC or line-call handshake | System record and deviation closure |
| Acceptance basis | Peak flow plus exception recovery | Representative shift and fallback route | Approved states and evidence retention |
A tightly optimized fleet may reach a higher rate inside a stable design case. More alternate routes, buffer space or spare capacity can improve graceful degradation but adds footprint, controls complexity or capital. Model both ideal and disturbed states.
A centralized WCS/WES can coordinate global priorities and exceptions; modular local control can isolate some failures and reduce coupling. Compare interface count, fallback, diagnostic visibility and vendor responsibility rather than treating either architecture as universally preferable.
Fixed automation can deliver higher deterministic capacity for stable SKU and order profiles with mature conveyor or AS/RS controls. Flexible robotics can phase faster and adapt layout under volatile demand, but rate, aisle width, load center and exception recovery must still be proven on the actual route. Choose by measured flow stability, not by technology label.
Greenfield allows a cleaner operating concept and material-flow layout. Brownfield protects existing assets and daily fulfillment through staged cutover, temporary traffic rules and fallback manual paths. Acceptance evidence should match the chosen deployment path.
Safety scanner fields, stopping behavior, rated load, residual capacity, system availability targets and conformity evidence are model- and application-specific. Confirm them in product documentation and the project validation plan. Typical RFQ units include kg for rated load, mm for clear width, loads/hour for throughput and seconds for interface cycle time under a named timeout rule.
Bring load mass and dimensions, clear width in mm, route length, movements/hour, peak duration, crossings, system calls and the abnormal state that matters most.